| In order to... | do this... | and this happens |
|---|
| Add Zeros of a Transfer Function |
- Tap on Add O button
|
- Button text changes its color to green to indicate Zero Insert Mode: Add O
|
- Tap somewhere on the imaginary plane inside the unit circle where you want to place the zero(s)
|
- A small circle indicating a Zero appears in the complex plane (along its complex conjugate)
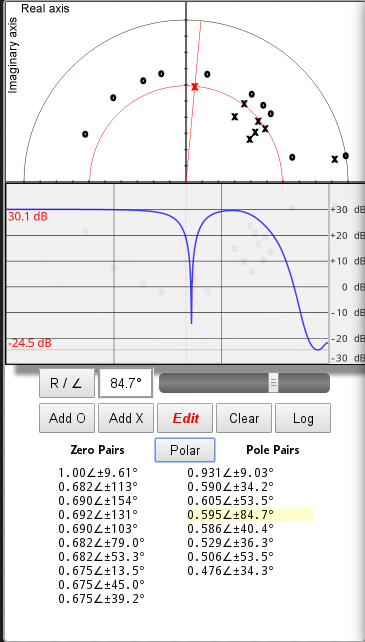
- The lower half of the unit circle is replaced by a Frequency Response reflecting the location of the zero(s)
|
| Add Poles of a Transfer Function |
- Tap on Add X button
|
- Button text changes its color to green to indicate Pole Insert Mode: Add X
|
- Tap somewhere on the imaginary plane inside the unit circle where you want to place the pole(s)
|
- A small cross indicating a Pole appears in the complex plane (along its complex conjugate)
- Frequency Response changes accordingly, reflecting the location of the pole(s)
|
| Edit the location of Zeros or Poles |
- Tap on Edit button
|
- Button text changes its color to red to indicate Zero/Pole Editing mode: Edit
|
- To select a certain Zero or Pole, tap somewhere close to it
|
- The Zero or Pole closest to your tap is selected
- Selected mark (Zero or Pole) is indicated by red color
- An origin-centered red circle with radius matching the distance of the selected mark from the origin appears indicating the path the selected mark can be moved on when its angle is changed
- A straight red line from the origin through the selected mark appears indicating the path the selected mark is moved on when its distance from the origin is changed
|
- To change the distance of the selected mark from the origin
|
- Distance Edit Mode is on by default. If it is not on, however, tap on the R / ∠ button once to select it. Another tap on the button will change the mode back to Angle Edit Mode.
- Tap on the slide control below the Frequency Response and slide it to the left. The selected mark will move closer to the origin.
- Move the slide control to the right and the selected mark will move closer to the unit circle.
- The action of the slider is smoother in the vicinity of the unit circle as accurate placement is more critical there, i.e. small changes in the distance from the unit circle in its vicinity result in big changes in frequency response.
- The distance from the selected mark is shown in the box next to the slider control.
- The coordinates of the selected mark are also updated in the Zero/Pole pairs list at the bottom of the display. The selected mark is indicated in the Zero/Pole pairs list with yellow background color.
|
- To change the angle of the selected mark
|
- Tap on the R / ∠ button once to select Angle Edit Mode. Another tap on the button will change the mode back to Distance Edit Mode.
- Tap on the slide control below the Frequency Response and slide it to the left. The selected mark will turn anticlockwise.
- Move the slide control to the right and the selected mark will turn clockwise.
- The action of the slider is smoother in the vicinity of the positive real axle as accurate placement is more critical there, i.e. small changes in angle close to the positive real axle result in big changes in frequency response.
- The angle of the selected mark is shown in the box next to the slider control.
- The coordinates of the selected mark are also updated in the Zero/Pole Pairs list at the bottom of the display. The selected mark is indicated in the Zero/Pole pairs list with yellow background color.
|
| Remove a Zero or Pole |
- If Zero/Pole Editing Mode is not on, tap on Edit button.
|
- Zero/Pole Editing mode is on: Edit
|
- Tap on the Zero or Pole you want to remove
|
- The selected Zero or Pole is indicated by red mark, circle and line
- If a wrong Zero or Pole was selected, tap again.
|
- To remove the selected mark, tap on Clear button
|
- The selected Zero or Pole disappears from complex plane and Zero/Pole Pairs list
- Frequency Response Plot is immediatelly updated to reflect the removal of the mark
|
| Remove all Zeros and Poles |
- If Zero/Pole Editing Mode is on, tap on Edit button to disable it
|
- Zero/Pole Editing mode is off: Edit
|
- Tap on Clear button
|
- All Zeros and Poles disappear
- Frequency Response Plot disappears
|
| Show Frequency Response Plot in logarithmic scale |
Tap on Lin button |
- Frequency Response Plot changes into logarithmic scale with frequency hairlines at fs/2000, fs/200, fs/20 and fs/2
- Lin button changes into a Log button
|
| Show Frequency Response Plot in linear scale |
Tap on Log button |
- Frequency Response Plot changes into linear scale
- Log button changes into a Lin button
|
| Hide Frequency Response Plot to see the whole unit circle |
Tap anywhere on the Frequency Response Plot area |
- Frequency Response Plot is removed and the whole unit circle with complex conjugate zeros and poles becomes visible
|
| Show previously hidden Frequency Response Plot |
Tap on Lin or Log button |
- Frequency Response Plot becomes visible in Linear or Logarithmic mode
- Tap on Lin or Log button to change Frequency Response Mode
|
| Show Zero/Pole Pairs in Coordinate Mode |
Tab on Polar button |
- Polar button changes into a Coords button
- Zero/Pole Pairs list values are shown in Coordinate mode
|
| Show Zero/Pole Pairs in Polar Mode |
Tab on Coords button |
- Coords button changes into a Polar button
- Zero/Pole Pairs list values are shown in Polar mode
|


